
Imagine you are using an online shopping website. You click “Buy Now,” but the page takes 8 seconds to respond. You may think the whole website is slow, but the real problem could be a payment service, database, API, or another service working in the background.
Modern cloud applications are made up of many connected services. Finding exactly where a problem occurs can be difficult. This is where cloud tracing becomes useful.
Cloud tracing helps developers follow a request as it travels through different parts of a cloud application. It can show where a request started, what services it visited, how much time each service took, and where an error happened.
In this guide, we will understand what cloud tracing is, how it works, its benefits, cloud tracing tools, OpenTelemetry, distributed tracing, use cases, challenges, and best practices in simple language.
What Is Cloud Tracing?
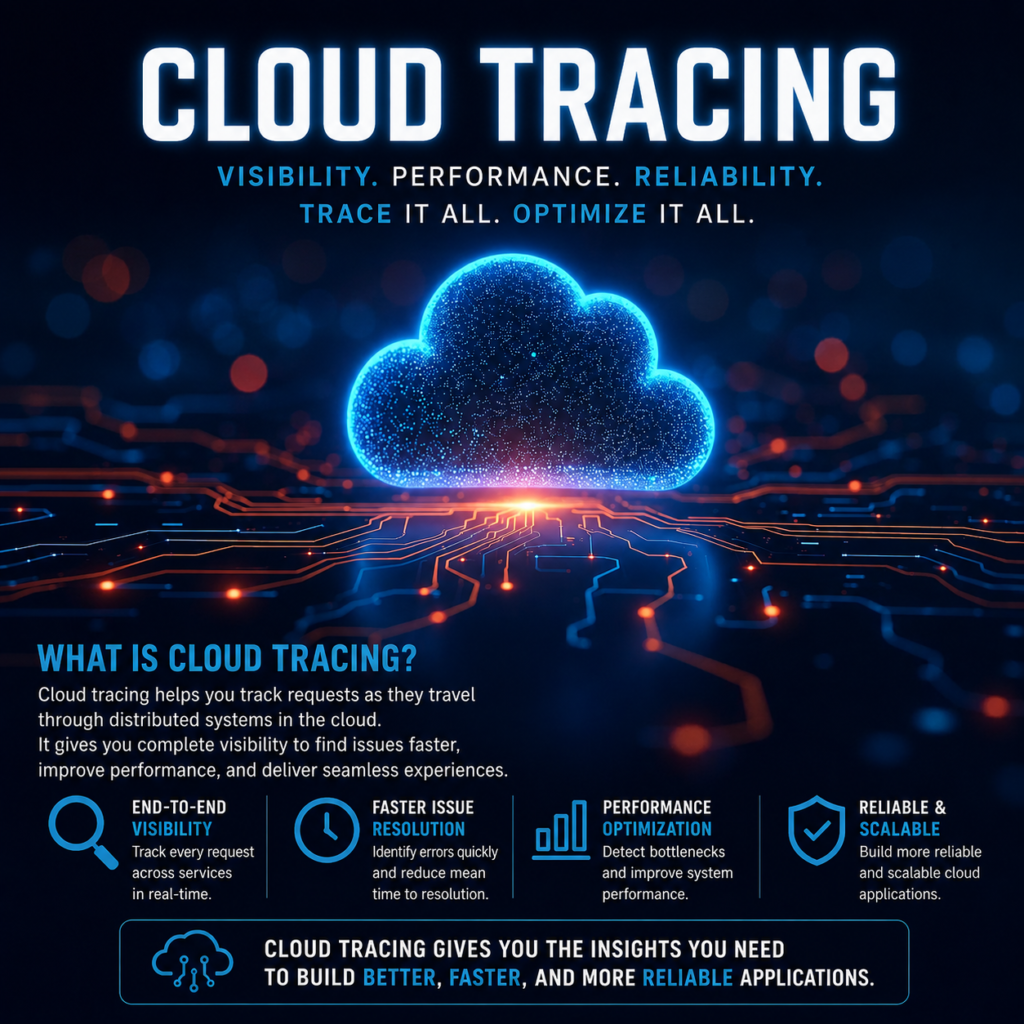
Cloud tracing is a technology used to track and understand the journey of a request through a cloud-based application.
A modern application is usually not one single program. It can contain many smaller services that communicate with each other.
For example, when you order something online, your request might travel like this:
Website → Login Service → Product Service → Payment Service → Database → Shipping Service
Cloud tracing records this journey and helps developers understand what happened at each step.
It can answer questions such as:
- Where did the request become slow?
- Which service caused an error?
- How long did each operation take?
- Was the database responsible for the delay?
- Which services were involved in the request?
In simple terms, cloud tracing is like GPS for a software request. Just as GPS shows the route of a car, tracing shows the route of a digital request.
How Does Cloud Tracing Work?
Cloud tracing works by collecting information about a request as it moves through different services.
For example:
User → API → Service A → Service B → Database → Response
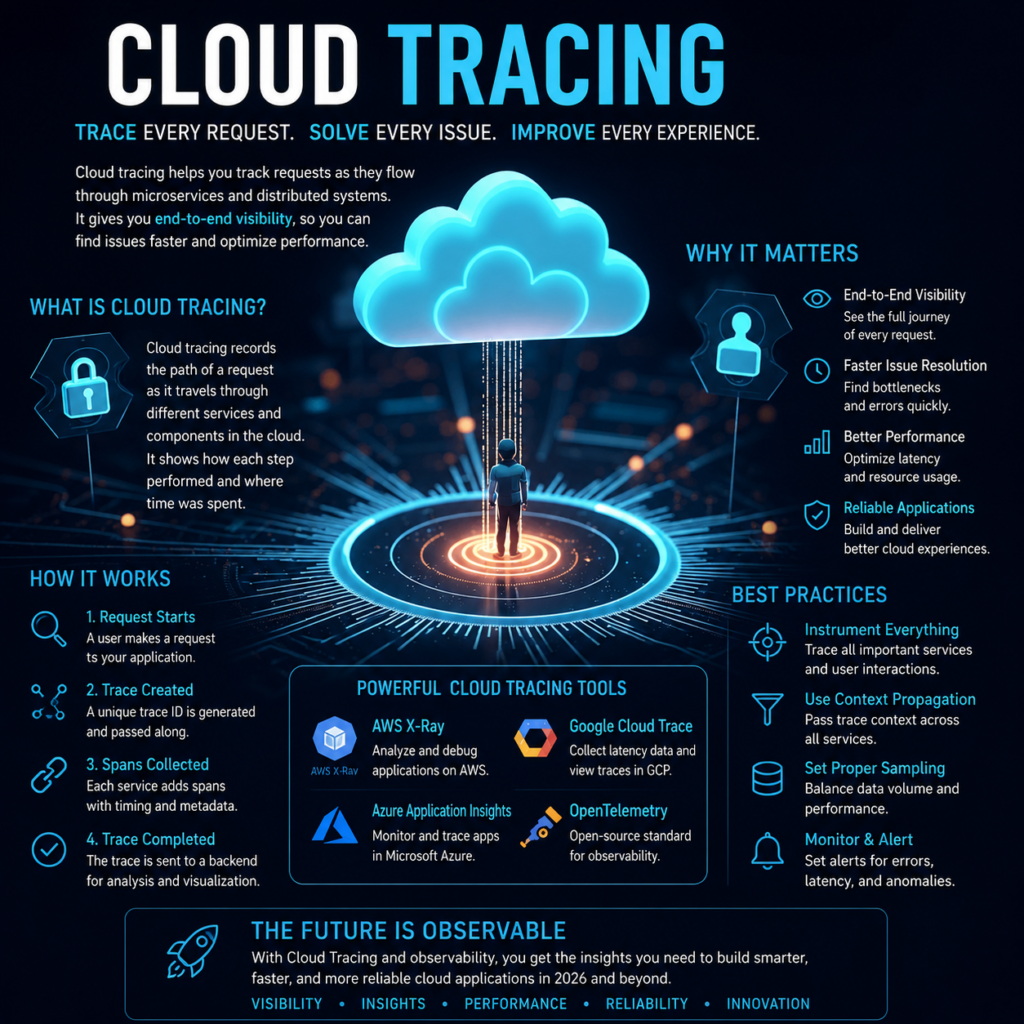
Each important operation creates information called a span. These spans are connected together to create a complete trace.
Suppose a food delivery application takes 5 seconds to process an order. Cloud tracing might show:
| Service | Time Taken |
|---|---|
| Login | 100 ms |
| Restaurant API | 200 ms |
| Database | 500 ms |
| Payment Service | 3,800 ms |
| Delivery Service | 400 ms |
The payment service is clearly taking most of the time. Developers can then investigate that service instead of checking the entire application.
What Is a Trace?
A trace represents the complete journey of a request.
For example, one trace could represent your entire journey from clicking “Buy Now” to receiving the confirmation message.
What Is a Span?
A span represents one individual operation inside a trace.
For example:
Trace: Online order
Spans: Login → Product search → Database query → Payment → Confirmation
So remember:
Trace = Complete journey
Span = One step in the journey
What Is Distributed Tracing?
Distributed tracing means following a request across multiple services in a distributed application.
Modern cloud applications often use microservices. Instead of one huge application, developers create many smaller services.
For example:
User Service → Order Service → Payment Service → Inventory Service → Notification Service
A single request can pass through all these services. Distributed tracing connects these operations so developers can understand the complete journey.
Difference:-
| 1 | 2 |
|---|---|
| Commonly used for cloud applications | Focuses on distributed systems |
| Helps monitor cloud-based services | Tracks requests across multiple services |
| Often connected with cloud platforms | Commonly used with microservices |
| Can include cloud infrastructure | Mainly focuses on request flow |
The two concepts often overlap because modern cloud applications are usually distributed.
Why Is Cloud Tracing Important?
Cloud applications can contain APIs, databases, containers, microservices, serverless functions, and third-party services.
If something breaks, checking every component manually can take a lot of time.
Cloud tracing gives developers a clearer picture of what is happening.
Benefits of Cloud Tracing
1. Faster troubleshooting: Developers can quickly locate errors and slow operations.
2. Better performance: Tracing can reveal slow APIs, database queries, and services.
3. Easier root-cause analysis: It helps developers find the actual source of a problem.
4. Better user experience: Faster applications generally provide a better experience.
5. Understanding microservices: Developers can see how different services communicate.
6. Reduced debugging time: Teams can spend less time searching through unrelated systems.
Cloud Tracing and the Three Pillars of Observability
Observability is the ability to understand what is happening inside a system by examining the information it produces.
The three common pillars are:
- Logs
- Metrics
- Traces
Cloud Tracing vs Logs vs Metrics
| Type | What It Shows | Example |
|---|---|---|
| Logs | What happened | “Payment failed” |
| Metrics | Numerical information | “CPU usage is 90%” |
| Traces | Request journey | “Payment service took 4 seconds” |
These three work best together. A trace might show that the payment service is slow, while logs explain the error and metrics show whether the server is overloaded.
Cloud Tracing for Microservices and Cloud-Native Applications
Microservices divide an application into smaller services.
For example:
User Service → Product Service → Order Service → Payment Service
This architecture makes applications flexible, but it also makes debugging harder because one request can travel through many services.
Cloud tracing connects these operations and helps developers see where the request went.
It is also useful for:
- APIs
- Kubernetes applications
- Serverless functions
- Databases
- External APIs
- Cloud-native applications
For example, if an API takes 6 seconds to respond, tracing can help determine whether the delay came from the API itself, a database, or another external service.
Common Cloud Tracing Use Cases
Cloud tracing can be useful in many situations.
Performance Monitoring
Developers can identify services and operations that are taking too long.
Latency Analysis
Latency means the delay between sending a request and receiving a response. Tracing helps identify where that delay occurs.
Error Detection
Tracing can show which service was involved when an error occurred.
Dependency Monitoring
Modern applications depend on many internal and external services. Tracing helps developers understand these relationships.
Best Cloud Tracing Tools in 2026
Several tools can be used for cloud tracing.
| Tool | Best Known For |
|---|---|
| Google Cloud Trace | Google Cloud applications |
| AWS X-Ray | AWS applications |
| Azure Application Insights | Azure monitoring |
| OpenTelemetry | Open-source observability |
| Jaeger | Distributed tracing |
Google Cloud Trace
Google Cloud Trace helps developers analyze application performance on Google Cloud. It can help identify slow requests and understand latency.
AWS X-Ray
AWS X-Ray helps developers analyze applications running on AWS by showing how requests move through different services.
Azure Application Insights
Application Insights is part of Microsoft’s Azure monitoring tools. It helps developers understand application performance and behavior.
OpenTelemetry for Cloud Tracing
OpenTelemetry is an open-source observability project that supports the collection of traces, metrics, and logs.
One of its biggest advantages is flexibility. It can be useful for applications running across different platforms and cloud providers.
Jaeger
Jaeger is an open-source distributed tracing platform. It can be useful for developers who want more control over their tracing environment.
How to Implement Cloud Tracing
Implementing cloud tracing generally involves four main steps.
Step 1: Choose a Tracing Tool
Select a tool based on your cloud provider, programming language, architecture, budget, and requirements.
Step 2: Instrument Your Application
Instrumentation means adding the ability to collect tracing information from your application.
Some frameworks support automatic instrumentation, while developers can add custom instrumentation when needed.
Step 3: Collect and Export Trace Data
The application produces telemetry data. This information is collected and sent to a tracing or observability platform.
Step 4: Analyze the Traces
Developers can examine:
- Slow spans
- Failed requests
- Database delays
- API latency
- External service problems
The goal is to find and fix bottlenecks.
Cloud Tracing Security and Privacy
Tracing data can sometimes contain sensitive information.
Developers should avoid putting passwords, API keys, payment information, or unnecessary personal information into trace data.
Important practices include:
- Protect trace data.
- Use access controls.
- Remove secrets from trace attributes.
- Collect only necessary information.
- Follow privacy and security requirements.
Cloud tracing should improve visibility without creating additional security risks.
Cloud Tracing Challenges and Limitations
Cloud tracing is useful, but it also has some challenges.
Large amounts of data: Large applications can generate millions of traces.
Higher costs: Storing and processing large amounts of telemetry can become expensive.
Complex setup: Distributed applications may require careful configuration.
Privacy concerns: Trace data can accidentally contain sensitive information.
Performance overhead: Poorly configured instrumentation may add some overhead.
What Is Sampling?
Sampling means selecting some traces instead of storing every single request.
For example, a company might record more information about failed requests while recording fewer normal requests.
This can reduce storage requirements while keeping useful information.
Cloud Tracing Best Practices
To get better results from cloud tracing:
- Start with important services.
- Use clear service and operation names.
- Monitor important APIs and databases.
- Protect sensitive information.
- Use an appropriate sampling strategy.
- Combine traces with logs and metrics.
- Review performance regularly.
- Track important user journeys.
The goal is not simply to collect more data. The goal is to collect useful data that helps solve real problems.
Cloud Tracing for AI and Agentic AI Applications
AI applications are becoming more complex. An AI application might communicate with an AI model, database, API, and external tools.
An agentic AI system can take multiple steps and use different tools before completing a task.
For example:
User → AI Agent → AI Model → Database → External API → Response
Cloud tracing can help developers understand each step.
It can track:
- AI model requests
- Tool calls
- API requests
- Database operations
- Errors
- Response times
As AI applications become more advanced, tracing can become increasingly important for debugging and performance optimization.
Future of Cloud Tracing in 2026
Cloud applications are becoming more distributed, while AI applications are adding even more complexity.
Future cloud tracing and observability systems are likely to focus on:
- AI-assisted troubleshooting
- Automatic anomaly detection
- Faster root-cause analysis
- Multi-cloud monitoring
- AI and agent tracing
- Automated performance optimization
The future is not only about showing developers what went wrong. Advanced observability tools can increasingly help explain why it happened and what should be done next.
Cloud Tracing FAQs
What is cloud tracing?
Cloud tracing is a method of tracking a request as it moves through different parts of a cloud application. It helps developers find errors, delays, and performance problems.
What is the difference between cloud tracing and distributed tracing?
Cloud tracing generally refers to tracing cloud-based applications, while distributed tracing focuses on following requests across multiple services. In modern cloud systems, the two often overlap.
Why is cloud tracing important?
It helps developers understand complex applications, identify bottlenecks, troubleshoot errors, and improve performance.
What are the best cloud tracing tools?
Popular options include Google Cloud Trace, AWS X-Ray, Azure Application Insights, OpenTelemetry, and Jaeger.
Is OpenTelemetry used for cloud tracing?
Yes. OpenTelemetry provides open-source tools and standards for collecting telemetry such as traces, metrics, and logs.
What is the difference between tracing, logging and monitoring?
Logs show events, metrics provide numerical measurements, and traces show the journey of requests through an application.
Is cloud tracing useful for microservices?
Yes. It is particularly useful for microservices because a single request can travel through many different services.
Cloud Tracing: Key Takeaways
Cloud tracing is basically a GPS for digital requests.
It helps developers understand where a request goes, how long each step takes, and where something goes wrong.
The key points are:
- Trace = complete request journey
- Span = individual operation
- Distributed tracing = tracking requests across multiple services
- OpenTelemetry = popular open-source observability technology
- Logs + Metrics + Traces = better observability
- Cloud tracing helps with performance, errors, latency, and debugging
- It is useful for microservices, APIs, Kubernetes, serverless, and AI applications
As cloud and AI systems continue to grow, understanding cloud tracing will become increasingly important for developers and technology teams.